Visualization is disabled by default due to performance reasons, but enabling it is
very easy. BioDynaMo can be configured through its own
configuration file: bdm.toml. Visualization is just one of the many configuration
options. Let's take a look at how to set it. We shall continue using the hello_world
example from the previous exercise.
Create the configuration file
In your simulation directory hello_world create a new file called bdm.toml.
You can do this from the command line with the following command:
touch bdm.tomlExport visualization files
One way to enable visualization is to export a visualization file every time step
(or every N time steps). In the bdm.toml file add the following lines:
[visualization]
export = true
interval = 1

	[[visualize_agent]]
	name = "Cell"
This will export a visualization file every time step. You can set the frequency
by setting the interval. Make sure that you run a good number of steps
so that the cells have time to divide. Set it to around 2000 for the hello_world example.
You can do this in src/hello_world.h in the Simulate(time_steps) function.
Run your simulation with biodynamo run.
Now we need to open ParaView:
Warning
Make sure you start ParaView from the project directory. Otherwise, ParaView might not find the exported files.
Make sure you start ParaView from the project directory. Otherwise, ParaView might not find the exported files.
Run
bdm viewwhich wraps the following commands (we recommend doing this exercise at least once to better understand the process):
paraviewSelect "File->Load State" as shown below:

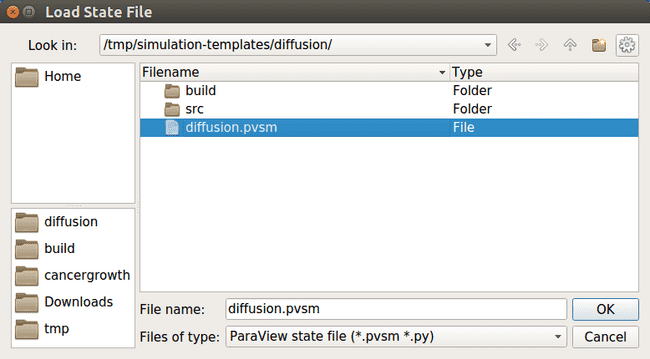
Navigate to your simulation output directory and select the pvsm file.

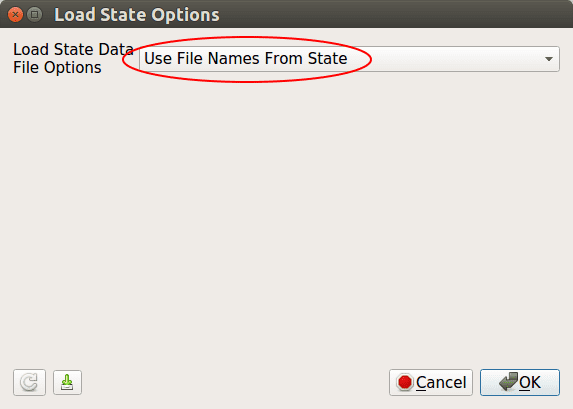
In the next window keep the default (Use File Names From State) and click OK.
